AI search reporting dashboard: what to track, what to show, and what to ignore
Build an AI search reporting dashboard that shows visibility, cited pages, competitors, business context, owners, and the next action. Includes a copyable prompt and template.
SEO, growth, and agency teams building an operational reporting layer for AI search
AI visibility / reporting
An AI search reporting dashboard can show citations moving in the right direction while nobody on the team knows which page to improve. That is not a reporting win. It is a prettier way to preserve uncertainty.
The useful version answers three questions quickly: what changed, where is the gap, and what should happen next. If the reporting layer cannot route attention to a page, a prompt family, a competitor pattern, and an owner, it is a screenshot archive with charts.
Best Next Step
Build a dashboard that leads to the next page decision
AgentSEO helps teams track prompt groups, source patterns, competitor overlap, and page-level movement so the dashboard becomes operational instead of decorative.
Start with the real job of the dashboard
The reporting model should reduce ambiguity, not hide it behind one bright number.
A page may rank well and still never be cited. A brand may be mentioned without being linked as a source. A cited page may drive no meaningful pipeline. Those are different problems, so the dashboard should expose them separately.
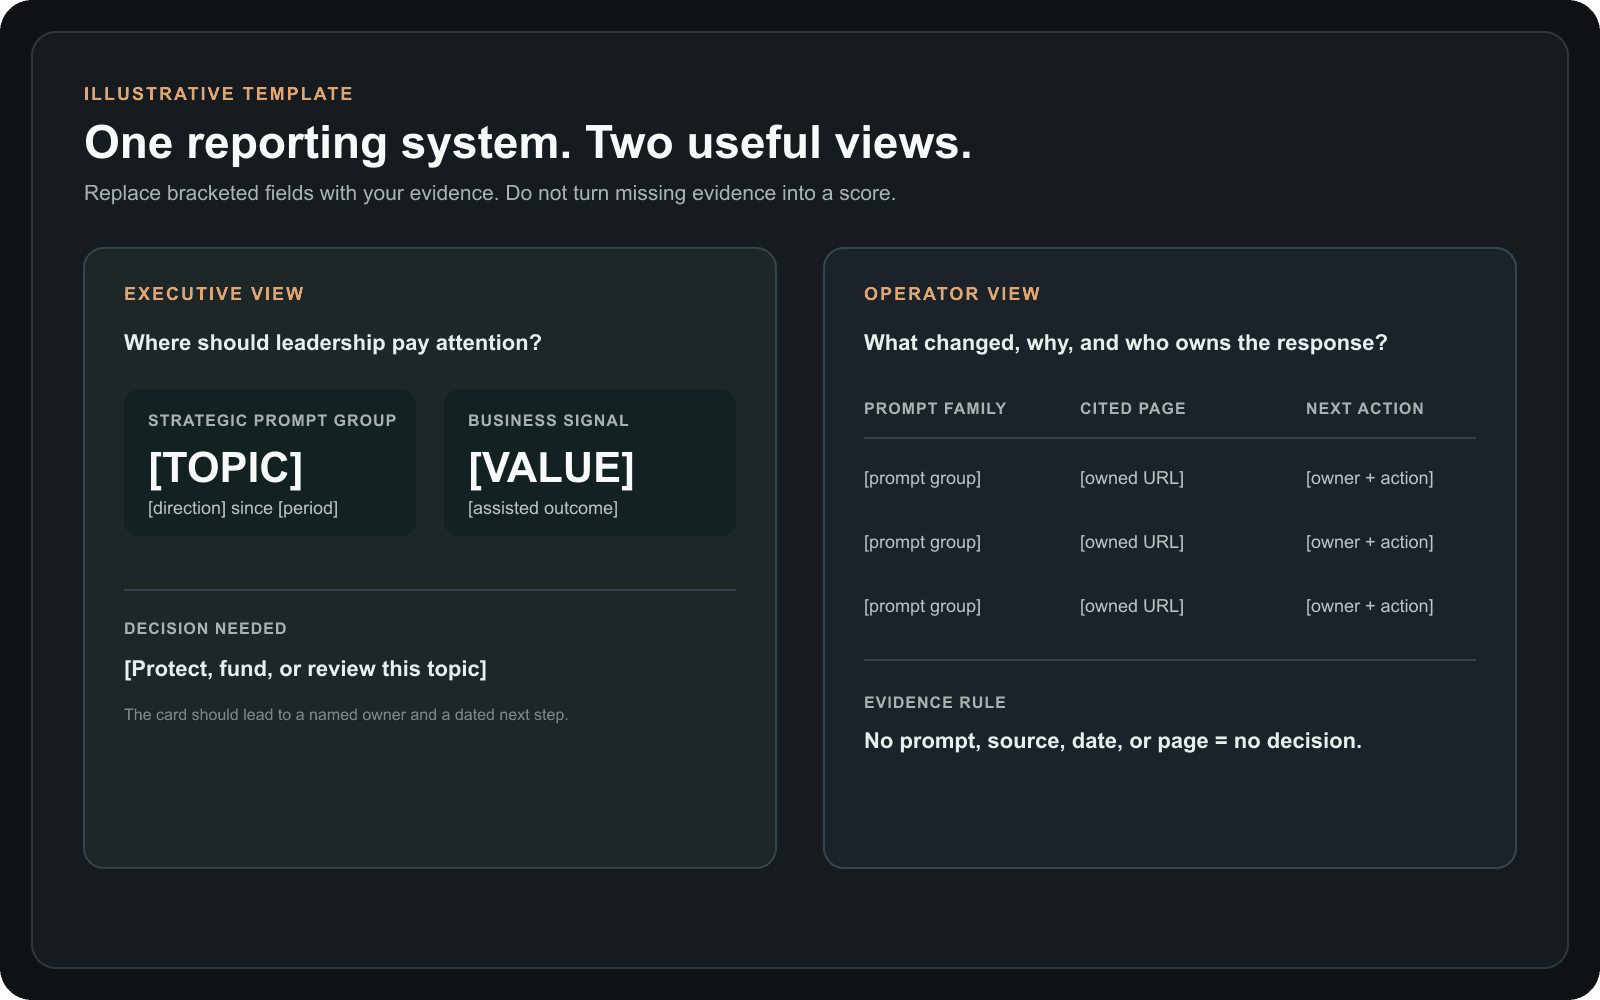
Once the dashboard reflects that structure, the team stops arguing about whether the metric is right and starts focusing on which operational gap deserves work first. That is also why the executive card and the operator table should be two views of one evidence set, not two competing reports.
- Discoverability: does the page rank or surface for the relevant query set?
- Source usage: does the answer engine appear to use the page as evidence?
- Explicit citation or mention share: is the brand named, linked, or repeatedly surfaced?
- Outcome movement: does the visibility lead to visits, assisted conversions, or pipeline-relevant action?
| Layer | What it shows | What it should route into |
|---|---|---|
| Search Console and classic search data | Impressions, clicks, CTR, and position movement | Discoverability diagnosis |
| Prompt and citation tracking | Mentions, first mentions, cited URLs, competitor overlap | Prompt-family and source-trust diagnosis |
| Page and owner mapping | Which asset moved and who should touch it | Refreshes, rewrites, internal links, or no action |
Search Console belongs in the stack, not at the center of the whole story
Google's new generative AI reporting matters, but it is still one input into the dashboard, not the whole board.
Search Console belongs in the reporting model because it gives you the Google-side discoverability layer: impressions, clicks, CTR, and position movement on the pages that matter. Google has also made AI-feature performance available within Search Console reporting, so the source is more useful than it used to be for watching Google-originated visibility.
It still does not answer everything. Search Console will not preserve your monitored prompt set across non-Google platforms, tell you which competitor kept replacing you in answer layers, or explain why one owned page keeps missing citations. That is why the dashboard still needs prompt, page, and owner layers underneath the summary cards.
- Use Search Console to monitor Google-side discoverability.
- Use prompt and citation layers to explain answer behavior.
- Use page mapping to decide which asset should change next.
- Do not let one Google report replace the rest of the operating model.
The dashboard needs distinct views, not one giant canvas
Different readers need different levels of resolution, but they should all come from the same saved evidence.
The most useful setup is a stack of views. One view for leadership. One for the working team. One for page owners. One for prompt-level review. The data can be shared. The views should not be identical.
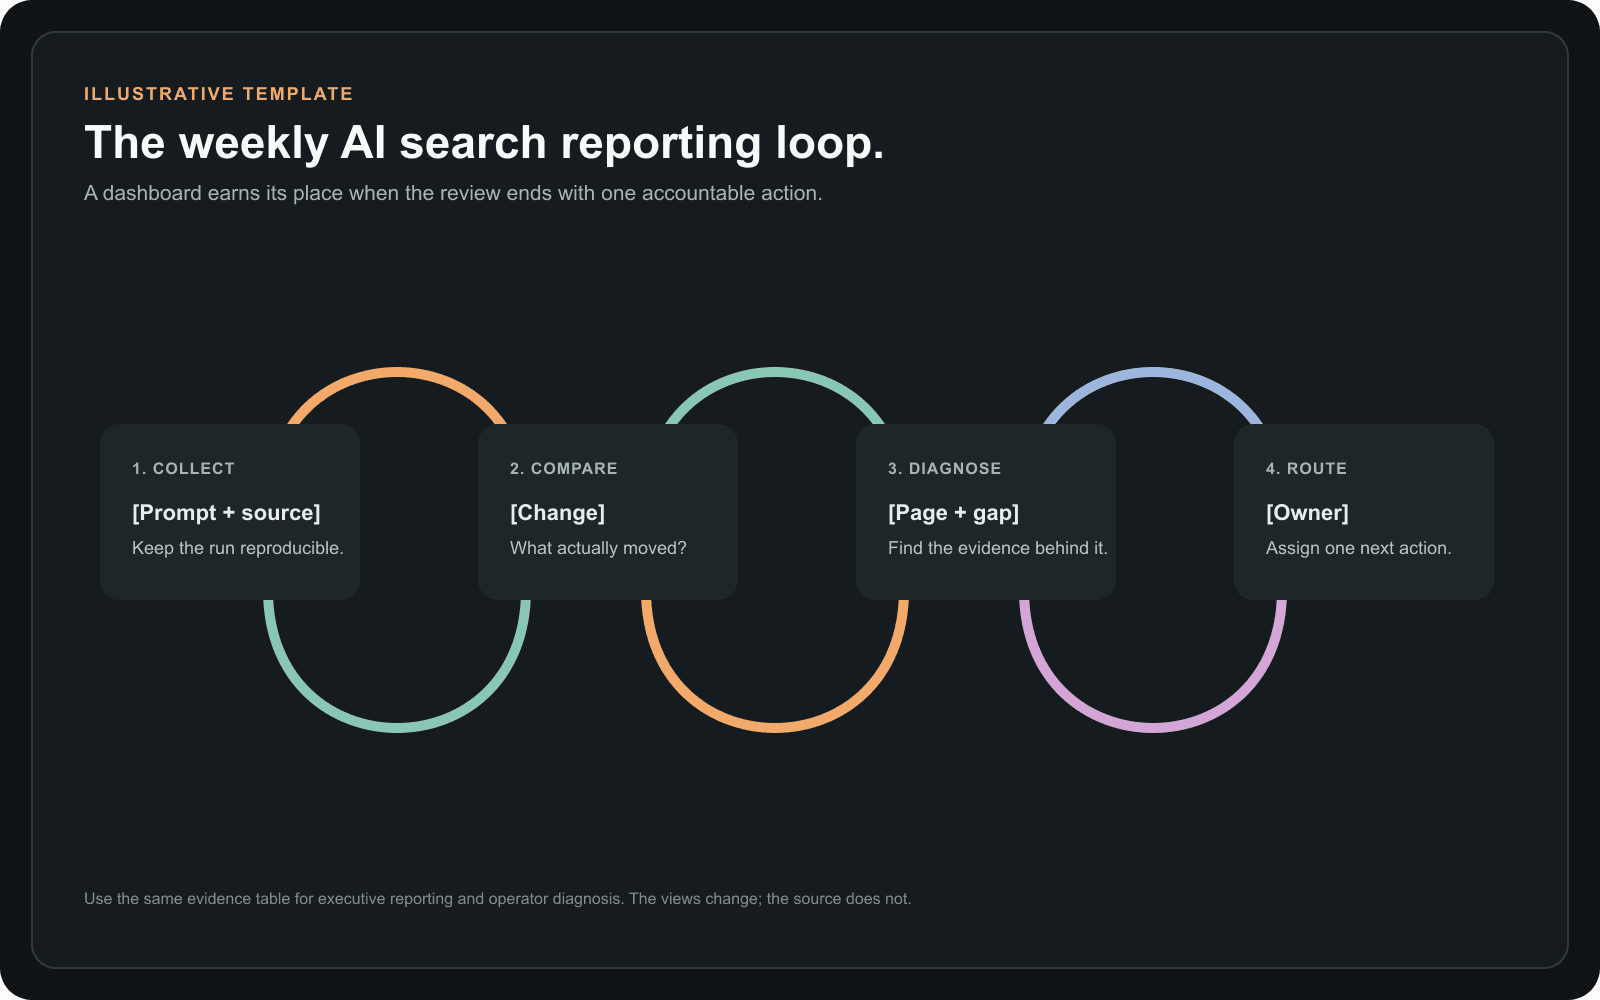
This is where most dashboards improve overnight. As soon as the operator can jump from a trend line to a prompt set, a cited URL, and a responsible page owner, the reporting starts to earn trust.
Related reading
How to measure AI visibility: tracker, audit, and dashboard metrics that matter
Use this to define the measurement system before you design the reporting layer around it.
Rank tracking vs LLM mention monitoring
Keep classic rankings, answer-layer mentions, and citations as distinct signals before rolling them into reporting.
- Prompt groups tied to real buyer or operator intent.
- Page-level and topic-level citation movement.
- Competitor share around the same monitored prompts.
- A direct path from metric to page, owner, and next action.
| View | Primary user | What it should answer |
|---|---|---|
| Executive summary | Founder or head of growth | Are we gaining or losing visibility on strategic topics? |
| Operator view | SEO lead or growth engineer | Which prompt families, platforms, or sources moved this week? |
| Page view | Content or product owner | Which URL gained, lost, or needs proof and structure changes? |
| Prompt view | Analyst or strategist | What did the answer say, who was cited, and who else appeared? |
The AI search metrics dashboard: five measures that route work
The best AI search metrics are interpretable, comparable, and easy to route into work.
Start with a small metric set that a working team can actually explain. Mention rate, first mention, citation rate, competitor overlap, page-level source movement, and downstream outcomes are usually enough to support real decisions.
For most teams, the best AI search metrics dashboard does not need twenty cards. It needs five measures that can tell a content lead whether to protect a winning page, repair a cited-page gap, study a competitor pattern, or leave a result alone.
- Mention rate by prompt family and platform.
- First mention rate for high-intent prompts.
- Citation rate and cited URL distribution.
- Competitor share on the same query set.
- Outcome metrics such as assisted visits, conversions, or influenced pipeline where available.
{
  "prompt_group": "[comparison intent]",
  "platform": "[platform]",
  "prompt_count": "[count]",
  "mention_rate": "[rate]",
  "first_mention_rate": "[rate]",
  "citation_rate": "[rate]",
  "top_cited_url": "[owned URL]",
  "top_competitor": "[competitor]",
  "owner": "[owner]",
  "next_action": "[protect, refresh, build, or monitor]"
}| Question | Best source | Expected output |
|---|---|---|
| What changed on strategic prompt groups? | Prompt tracker + Search Console | Winners, losers, and stable rows |
| Which page deserves review first? | Page and citation view | One named URL and owner |
| Did the change affect business quality? | Analytics or CRM layer where available | Assisted visits, conversion quality, or influenced pipeline |
| What should the team do next? | Operator view | Protect, refresh, build, or monitor |
Use a reporting prompt that does not manufacture certainty
A good reporting prompt keeps the AI in an analyst role and makes missing evidence visible.
A language model can help compress a working table into a clean weekly brief. It should not be asked to infer citations, conversion impact, or competitive causes that are not present in the evidence. Give it the evidence rows, name the decision maker, and make uncertainty part of the requested output.
This prompt is deliberately tool-agnostic. Paste it into the environment your team already uses after attaching or pasting the validated rows from the dashboard template.
- Use [EXECUTIVE] when the reader needs a decision, not a research dump.
- Use [OPERATOR] when the reader needs page-level diagnosis and owner routing.
- Leave unknown fields blank and let the model report the gap.
You are reviewing an AI search reporting dashboard for [COMPANY].

Reporting period: [DATE RANGE]
Primary audience: [EXECUTIVE OR OPERATOR]
Strategic prompt groups: [LIST]
Validated evidence rows: [PASTE CSV OR TABLE]

Return four sections:
1. What changed: state only movements supported by the evidence rows.
2. Why it may have changed: separate direct evidence from hypotheses.
3. What to do next: name one page, one owner, and one action for each priority issue.
4. What is missing: list the prompt, source, date, page, or outcome data needed before a decision.

Rules:
- Do not invent citations, mentions, competitors, rankings, or business impact.
- Do not collapse missing values into a composite score.
- Keep the executive summary to five bullets when [EXECUTIVE] is selected.
- Preserve URLs, source names, and dates exactly as supplied.
- Mark every hypothesis as a hypothesis.Copy the AI search reporting dashboard template
Start with evidence-level rows, then calculate executive summaries from the same source table.
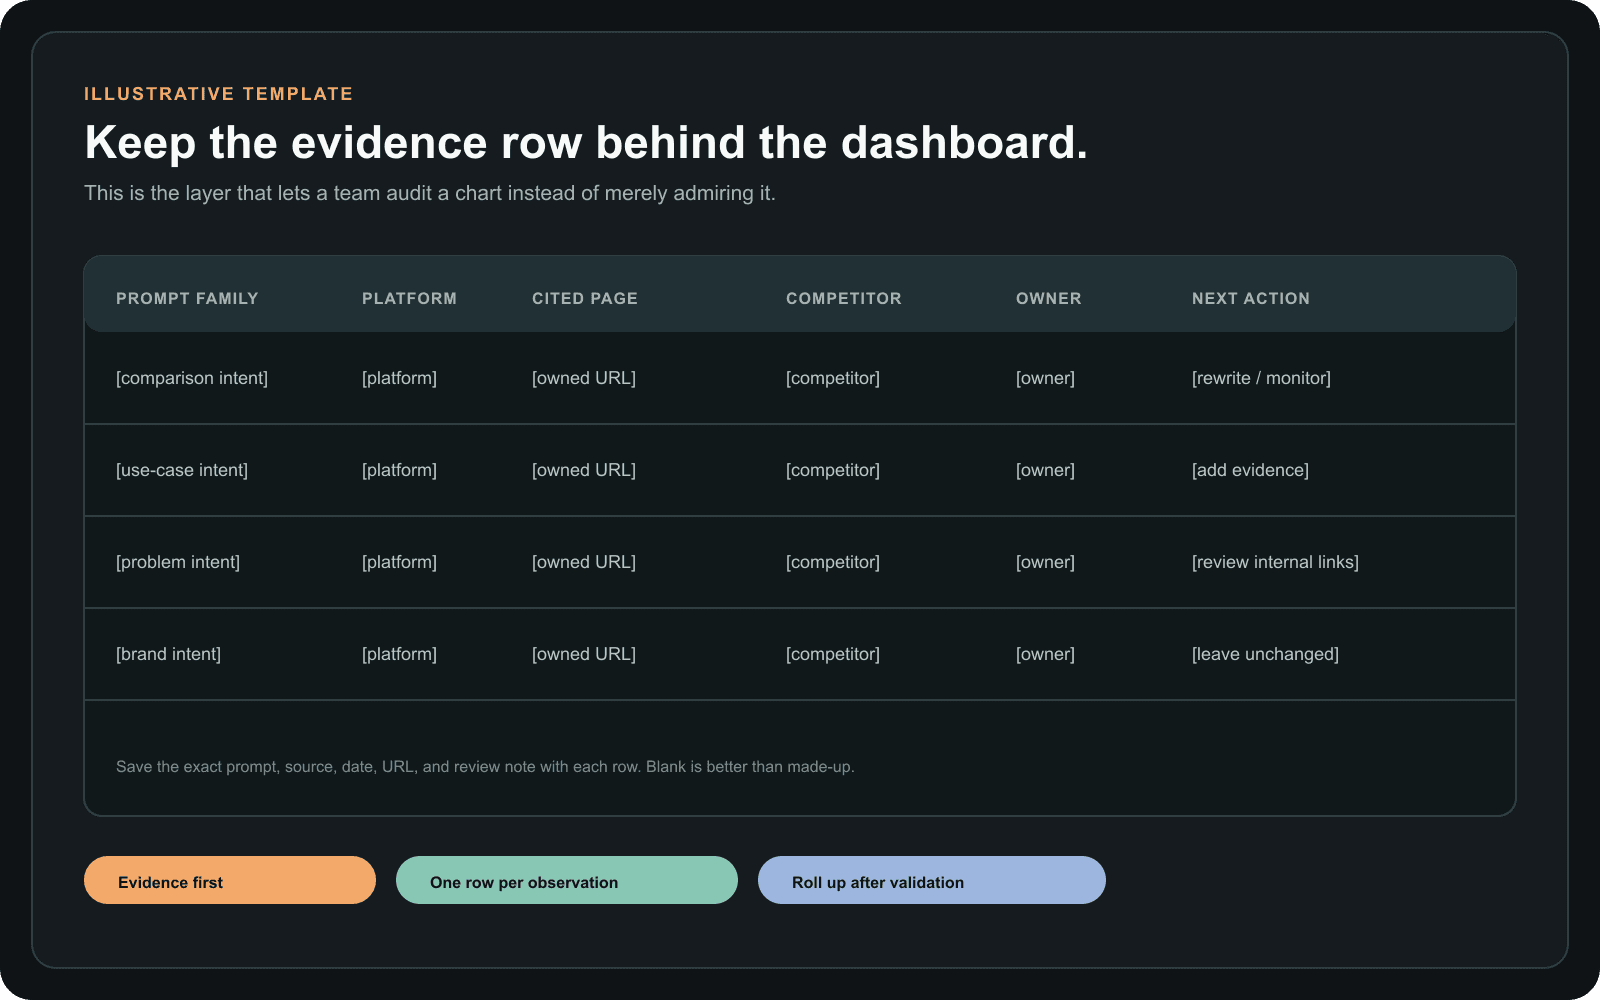
The safest reporting model begins with one row per monitored prompt, platform, and date. That row preserves the answer-layer outcome, cited URL, competitor, mapped owned page, classic Search movement, owner, and next action. Leadership cards should be calculated from those rows instead of maintained as a separate truth.
The downloadable CSV uses this evidence-first shape. Keep the prompt set stable, add rows on a regular cadence, and connect the table to your preferred spreadsheet or business-intelligence tool only after the fields are trustworthy.
Related reading
| Field group | Required fields | Why it belongs |
|---|---|---|
| Run identity | week, prompt group, platform, prompt | Makes every trend reproducible and comparable |
| Answer evidence | mention, first mention, citation, cited URL, evidence URL | Preserves what actually happened instead of only a score |
| Competitive context | top competitor and source overlap | Explains who displaced the brand and where |
| Owned-page context | mapped page, Search impressions, clicks, position | Connects answer-layer movement to the asset the team can improve |
| Business and action | assisted visits, conversions, owner, next action, notes | Turns reporting into accountable work |
What leadership should see, and what should stay in the working view
The executive dashboard is a decision surface. The operator dashboard is the evidence trail behind it.
A founder, CMO, or agency lead rarely needs a list of every monitored prompt. They need a short view of strategic topic movement, the business context available, the risk or opportunity, and the decision that needs attention. That is a very different interface from the one an SEO lead uses to diagnose a missing citation.
Do not solve that difference by making two reporting systems. Keep one evidence table. Filter and summarize it for leadership. Let the working team retain the sources, dated prompts, pages, competitors, and notes that explain the headline.
| Best for | Show this first | Keep one click away |
|---|---|---|
| Founder or CMO | Strategic-topic direction, business context, and decision needed | Prompt evidence, cited pages, competitor detail, owner notes |
| SEO or growth lead | Prompt-family and page movement, priority queue, accountable owner | Raw answer text and supporting source context |
| Content or product owner | Named page, diagnosis, and requested change | Topic-level trend and comparable competitor examples |
What the dashboard should not show
Avoid metrics that look precise but do not help anyone decide what to change.
I would avoid invented composite scores unless every component is visible and useful on its own. I would also avoid dashboards that show answer movement without preserving the prompt, the source context, or the page that needs work.
The most expensive reporting mistake is false neatness. Teams start trusting a number that is no longer tied to the actual answer behavior in the market.
- One blended AI visibility score with no breakdown.
- Prompt checks with no saved prompt set or source context.
- Charts that move without naming the page, source, or competitor behind the change.
- Executive-only dashboards with no operator layer underneath them.
Where AgentSEO fits
AgentSEO fits the measurement and workflow layer behind a serious AI search dashboard.
The dashboard becomes much more useful when the underlying runs are compact, structured, and comparable over time. That is where AgentSEO helps. It gives teams a cleaner search-intelligence layer for search demand, SERP analysis, prompt-led research, and follow-up routing inside the workflows they already operate.
The goal is not a second dashboard for its own sake. It is a better evidence layer behind the page decisions, reporting table, and weekly review the team already needs to run.
Keep the workflow moving
Build a dashboard that leads to the next page decision
AgentSEO helps teams track prompt groups, source patterns, competitor overlap, and page-level movement so the dashboard becomes operational instead of decorative.

Daniel Martin
Cofounder, AgentSEO
Inc. 5000 Honoree and cofounder of AgentSEO and Joy Technologies. Daniel has helped 600+ B2B companies grow through search and now writes about practical SEO infrastructure for AI agents, MCP workflows, and REST-first execution systems.
FAQ
Questions teams usually ask next
Should I use one AI visibility score in my dashboard?
Usually no. A single score hides too much. It is better to separate discoverability, citations, mentions, competitors, and downstream outcomes so the team can see where the real gap lives.
What is the biggest dashboard mistake right now?
Treating screenshots or one-off answer checks as if they were a reporting system. Without a saved prompt set, source context, and page-level action path, the dashboard becomes vanity.
Can executives still get a simple summary?
Yes. Roll up the working metrics into a clean summary view, but keep the operator layer underneath so the team can still debug and act on what changed.
What should an AI search dashboard show first?
Start with prompt groups, mention and citation movement, top cited pages, competitor overlap, and the page owner or next action tied to each meaningful change. For leadership, summarize those rows into strategic-topic direction, business context, and one decision needed.
Which metrics belong in an AI search metrics dashboard?
Use metrics that route work: mention rate, first mention rate for priority prompts, citation rate, cited-page distribution, competitor overlap, classic Search movement, and downstream outcomes where you can validate them. Keep the source, prompt, date, and owned page behind every roll-up.
Can I use AI to summarize the dashboard?
Yes, after the underlying rows are validated. Ask the model to summarize observed movement, distinguish evidence from hypotheses, assign a page and owner, and state what data is missing. Do not ask it to fill missing citations or business impact with a plausible story.
More in this topic
AI visibility and AI search
Measurement
How to measure AI visibility: a practical tracker, audit, and reporting system
Measure AI visibility with a fixed prompt set, raw answer records, citation and mention metrics, and a reporting loop that sends each signal to a page decision.
AI visibility
Google AI Mode guide: what it is, what changed, and how to adapt SEO
Learn what Google AI Mode is, how it works, how it differs from AI Overviews, and what Google's official guidance means for SEO in 2026.